At ChronoDiali, I work on the internal tools and systems that support our nationwide e-commerce logistics operation. Beyond building backend tools and automations, I've spent the last few months turning raw shipment and CRM data into two Power BI dashboards that different teams now use to make decisions: one for sales, one for operations.
This post walks through what each dashboard does, why it was built that way, and a few real data problems I hit (and fixed) along the way. All figures and identifiers below are illustrative — the dashboards described use real company data, but nothing proprietary is shared here.
Dashboard 1: Customer Lifecycle Segmentation (for Sales)
The business question
Sales didn't have a simple way to answer: "which clients are at risk of leaving, and which ones have already gone quiet?" Order history existed in the CRM, but nobody had turned it into an actionable signal.
The approach
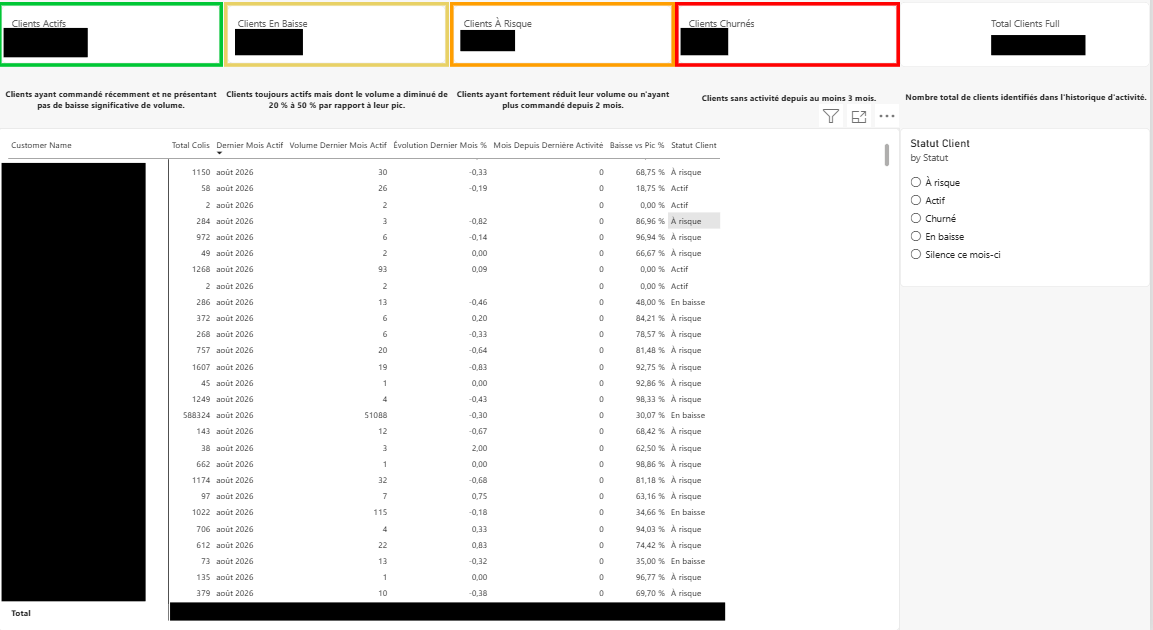
I defined four lifecycle states based on shipment volume and recency, computed in DAX:
- Actif — ordering recently, no significant drop in volume
- En Baisse — still active, but volume down 20-50% versus their peak
- À Risque — volume down sharply, or no order in 2+ months
- Churné — no activity in 3+ months
Statut Client =
VAR MonthsSinceLastActivity = [Months Since Last Order]
VAR VolumeDropPct = [Volume Drop vs Peak %]
RETURN
SWITCH(
    TRUE(),
    MonthsSinceLastActivity >= 3, "Churné",
    VolumeDropPct >= 0.5 || MonthsSinceLastActivity >= 2, "À Risque",
    VolumeDropPct >= 0.2, "En Baisse",
    "Actif"
)
The dashboard surfaces this as four KPI cards (count per status) plus a sortable table per client, with columns for total parcels, last active month, volume trend, and drop-versus-peak percentage — so a sales rep can immediately see why a client landed in a given bucket, not just the label.
What it enabled
Sales now has a prioritized list instead of guessing which accounts to call. Clients in "À Risque" with high historical volume are the clearest priority — a simple rule, but one nobody had operationalized before.
Dashboard 2: SLA & Route Performance (for Operations)
The business question
Operations tracks delivery SLAs informally, but there was no systematic view of where breaches were concentrated — which hubs, which routes, which couriers.
The SLA rule
Delivery SLA at ChronoDiali depends on the origin-destination pair: shipments touching our main Casablanca hub have a 24-hour target; everything else is 48 hours.
SLA Target (Hours) =
VAR OriginIsMainHub = Shipments[Origin Hub Code] = "CMN01"
VAR DestIsMainHub = Shipments[True Destination Hub] = "CMN01"
RETURN
IF(OriginIsMainHub || DestIsMainHub, 24, 48)

Delivery Duration (Hours) =
DATEDIFF(Shipments[First Pickup Completed], Shipments[Delivery Time], HOUR)

SLA Met =
IF(
    ISBLANK(Shipments[Delivery Time]),
    BLANK(),
    IF(Shipments[Delivery Duration (Hours)] <= Shipments[SLA Target (Hours)], 1, 0)
)
From there, a handful of measures roll this up into compliance %, breach %, and average delay for breached shipments only — plus a live "currently overdue" count for shipments still in transit that have already blown past their window.
Visualizing it
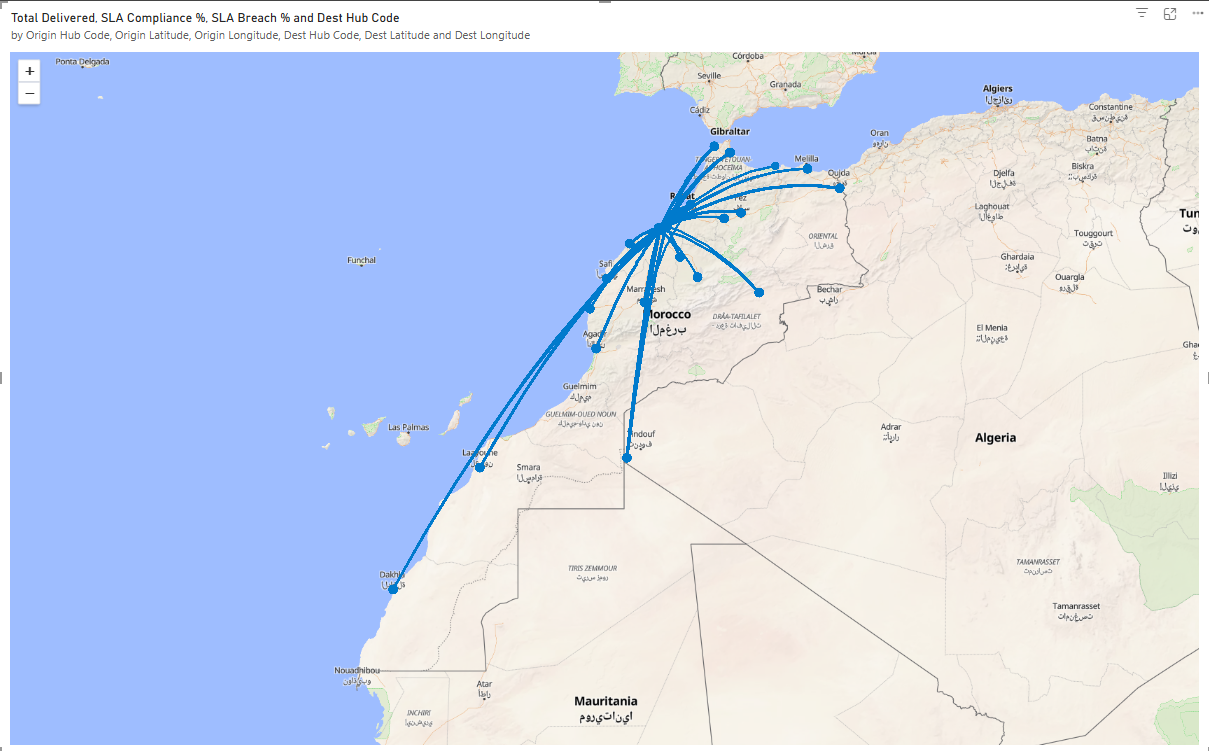
The main page has KPI cards up top (total delivered, compliance %, breach %, currently overdue, average delay), a compliance trend over time, and two breakdown charts — breach rate by route and by origin hub — so operations can see at a glance whether a problem is isolated to one route or systemic.
I also added an origin-destination map, plotting each hub-to-hub route with line thickness tied to shipment volume and color tied to breach rate — which made it immediately visible that breach rates cluster heavily around a handful of long-haul routes rather than being evenly spread across the network.
Two data problems worth mentioning
Building this surfaced two real issues in the underlying data, which I think are worth describing because catching them mattered more than the dashboard itself:
1. "Last attempt hub" isn't "destination hub." My first version of the SLA rule used the hub of the last delivery attempt as the destination. But a shipment that failed delivery and bounced to a different hub before succeeding would show the wrong SLA target and a wrong route on the map. I traced this back to the data model and switched to the shipment's actual current/delivered hub instead — a small fix with a real effect on accuracy.
2. Hub coordinates with a decimal-separator bug. A reference table mapping hub codes to latitude/longitude had its decimal points silently stripped (likely a French-locale comma being read as a different separator somewhere upstream), turning 33.60493304 into 3360493304. Re-importing that table with the correct locale setting in Power Query fixed it — otherwise the map would have silently misplaced half the country's hubs.
Why this matters
Both dashboards replace manual, ad-hoc reporting with something that updates automatically and answers a specific business question for a specific team. The segmentation dashboard turned "who should we call?" into a ranked list; the SLA dashboard turned "are we hitting our delivery promises?" into a concrete, route-level breakdown instead of a vague sense that "some deliveries run late."
Next, I'm working on turning the manual CRM export behind these dashboards into an automated Python pipeline with built-in data-quality checks — so issues like the ones above get caught automatically instead of by hand.
There's more I can't show here
Beyond these two, I've built several other dashboards at ChronoDiali, along with the automation scripts and Python/PostgreSQL pipelines that feed them — extracting, cleaning, and loading data from internal systems so these dashboards stay up to date without manual exports. I can't share those publicly since they involve internal company data, but I'm happy to walk through the approach and the engineering behind it in more detail.
If that's the kind of work you're hiring for, reach out: somoncef@gmail.com.